
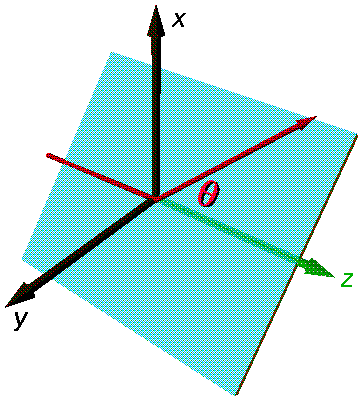
In 3D we choose to have the coordinate frame
oriented so that the z axis [the green axis
in the below pictures] is aligned with
initial velocity vector. The final velocity vector and the initial velocity
vector define a plane (the scattering plane) which is
in general tilted at some angle  with respect
to the x-axis. [In the below picture
  is about
-45°.] The scattered particle [the red arrow], exits the scene
at an angle
  with respect
to the z-axis. [In the below picture
  is about
+45°.] Viewed in the scattering plane (as in the above picture),
we return to exactly the same situation as in the 2D reflection.
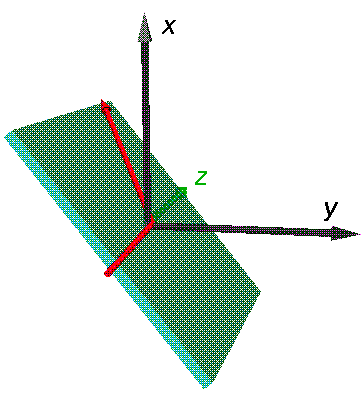
Click here for a 3D version of the scattering plane.
Classically we describe the situation in terms of impact parameter (b), which is the distance the incident particle would miss the origin in the absence of the potential. The impact parameter is closely related to the particle's angular momentum vector L and linear momentum p:
|L|= bp
where p=(2mE)½.
Note that L is perpendicular to the scattering plane.
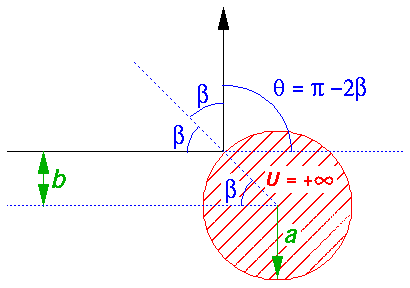
In the geometric construction displayed in the top picture
we see that the
scattering angle  is simply
related to
  , which is in turn related
to the impact parameter:
b=a sin( )
)
Thus:
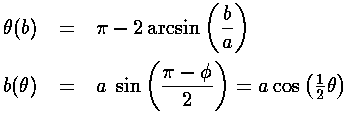
We assume now that our scattering center is in a uniform stream of incident particles: an incident beam of particles (I particles/sec) distributed throughout some beam radius (w) much larger than a. We seek the rate at which particles are scattered into a finite-sized detector (area A) which is located some large distance R from the scattering center. Particles traveling within the outlined blue cone are destined to end up in the detector.
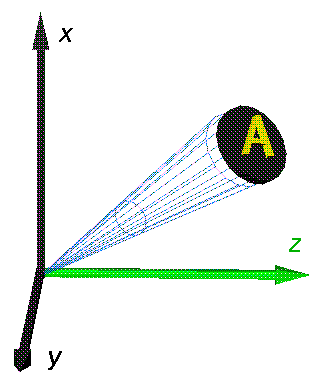
Assume, for the moment, that the scattering is uniform (isotropic), so that the detector sees the same number of scattered particles/sec at any location on the surface of a sphere of radius R surrounding the scattering center. The fraction of total number of scattered particles seen by the detector is clearly just the ratio of the detector's area to the total area of the sphere:

The geometric factor: A/R2 determines the
fraction detected; it is called the solid angle
(
 ) subtended
by the detector, and it plays much the same role as
radian measure (
 =s/R).
[Like radian angles, solid angle is dimensionless but nevertheless is
reported using a the unit (called: steradian). 2
 radians is all of a circle; 4
 steradians is all of a sphere.]
For example, consider a band on a sphere:
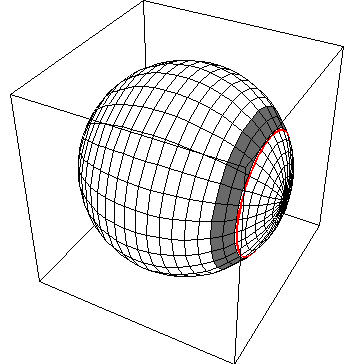
which consists of all the points on the surface of the sphere
with  in the range:
[
 ,
, +
+

 ]. Note the red circle on the inner
edge of the band. We find the area of this band
using the below diagram, which is based on a cross-section of the
sphere using the x-z plane. (Note: the plane cuts the red circle
in two points [the two red dots] and reduces the gray band to two gray
segments next to the red dots.)
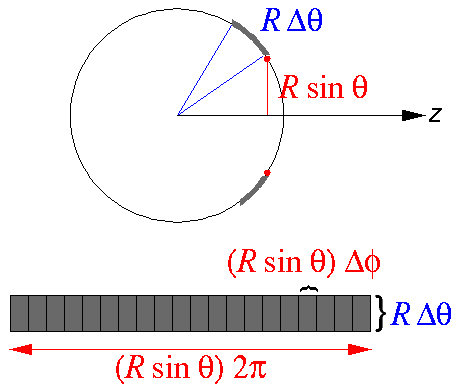
See that the radius of the red circle is R sin  (which is of course less than the radius of the sphere which is R).
The circumference of the red circle (which forms one side of the flattened out
band) is then 2
 (R sin
  ).
The width of the band is found (using radian measure) to be
R
 . Thus multiplying the length and the width
of the band we find the ban's area and hence the solid angle it subtends:

Below we will find it convenient to consider a detector formed into a band like the above.
Clearly the rate particles are detected is proportional to
the flux (J=I/ w2) of particles in the beam.
(In fact clearly the fraction of scattered particles
is (a/w)2.)
We assume the beam is uniform
so that, upstream, the number/sec of particles going through some particular fraction of the
beam's cross-section is just proportional to the area of that particular fraction. In particular
we consider an (upstream) annulus, centered on the z-axis, with maximum
radius (b+ b) less than a and with thickness
 b. The number/sec of particles passing through this annulus
is just proportional to the area of the annulus. In particular:
the number/sec of beam particles in through the annulus
= J 2 b
b
 b
b
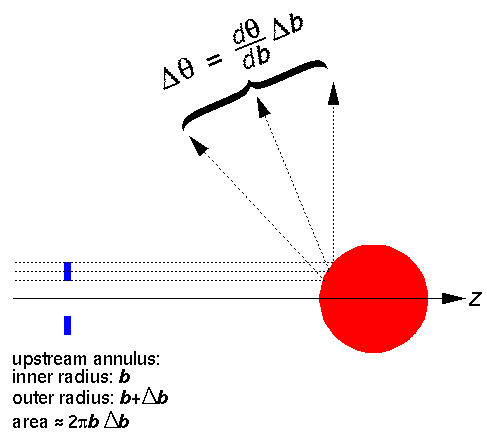
If we follow the trajectory of the large-b particles
and the small-b particles in this group we find they end up going
in slightly different directions (
 )
given by the above relationship
  (b). We choose
 b and b so that the particles that
go through the upstream annulus end up
in our above detector: a band around the sphere.
We now define the differential cross section  :
:

The differential cross-section is large in directions the particles frequently scatter.
Note that our result is much like the 2D case.
The differential cross-section is large at rainbow angles for exactly the same reason
as in the 2D case:  has a maximum or minimum as a function of
b, and so the derivative in the above formula is infinite.
There is a new way of making large differential cross-section is 3D:
have the sin in the denominator go to zero (i.e., exact
backward or forward scattering for a non-zero b). In this case
a "finite" number of particles going through the upstream annulus end up
concentrated into an "infinitesimal" solid angle near the backward or forward
direction, producing an infinite differential cross-section in that direction.
The result is called a glory.
For the particular case of the classical differential cross-section for our 100% reflecting sphere, we find that the scattering is isotropic, i.e., independent of angle:
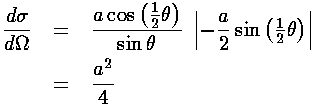
Note that the energy of the incident particles has no effect on their trajectory, so the classical differential cross-section is independent of energy and angle.
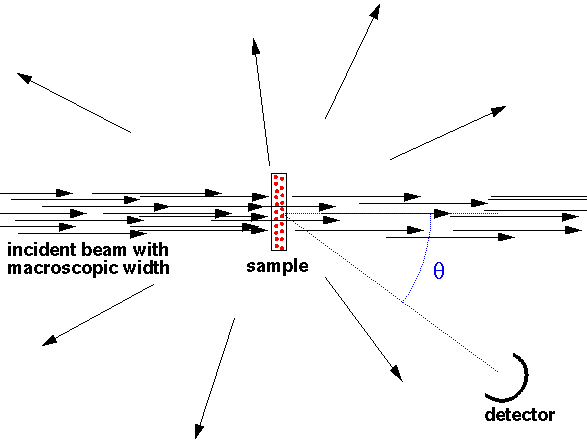
Clearly real experiments are not performed with just one scatter in the beam...that would waste almost all of the beam. Instead often a "thin" sample (thin enough so there is little multiple scattering) fully covers the beam and the cross-section is calculated from:

Since the problem is spherically symmetric, it makes sense to solve Schrödinger's equation in spherical coordinates. Every place the particle can be (i.e., r>a or r'>1 in our dimensionless coordinates), the potential is zero so as we have shown the solutions are in terms of spherical Bessel functions, e.g.,:
 = jl(k'r')
Ylm(
 ,
, )
)
where E'=k'2. We seek a solution that looks like a beam coming moving in the +z direction plus a scattered wave moving radially:

Of course,  must also satisfy the boundary condition
and be zero at r'=1.
We can extract the cross-section from this formula. The flux in the
beam is  k/m. For the scattered part of the
wavefunction, in the limit of large r, the radial flux
(jr=j·r/r) is |f|2
 k/mr2.
Thus the number/sec of particles going through a distant radial surface of area
R2
 is |f|2
 (k/m)
(k/m)
 .
The differential cross-section is then:

We begin by noting that since exp(ik'z') is a solution to the totally free (U=0 everywhere) Schrödinger's equation, it can be expressed in terms of solutions to the totally free Schrödinger's equation in spherical coordinates:

Now instead of having jl, we would like to have solutions to our actual Schrödinger's equation, i.e., spherical Bessel functions, but zero at r'=1. We proceed by expressing jl in terms of its incoming and outgoing radial waves (i.e., in terms of spherical Hankel functions). We expect that the incoming wave is not modified by the potential, but the outgoing wave may be modified by the potential. Now since the outgoing flux must still equal the incoming flux (i.e., probability must be conserved for each value of angular momentum l), we cannot not change the amplitude of the outgoing wave, only its phase. Thus we insert a phase factor which is adjusted to match the boundary condition.
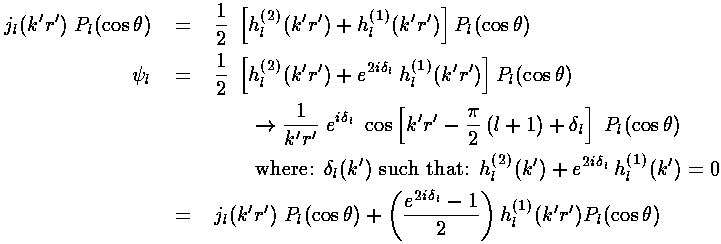
By putting together solutions like the above, we can form a solution that looks like exp(ik'z') plus a scattered wave:

Now we have
an expression for f (and hence the cross-section) in terms of
the phase shifts:  l.
l.
We note that the equation for the energy dependent phase shifts
 l
are not as formidable as they may appear; they are simply the phase
of h(2)(k') less 90°. We show below
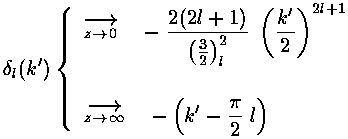
the asymptotic forms for the phase shifts obtained simply by substituting
in the asymptotic forms for jl and yl
previously given.
Here are plots of the phase shifts for l=0,1,2. The red curves display the low energy approximations, the blue curves display the high energy approximations. (Note that for l=0 the approximations are exact.)
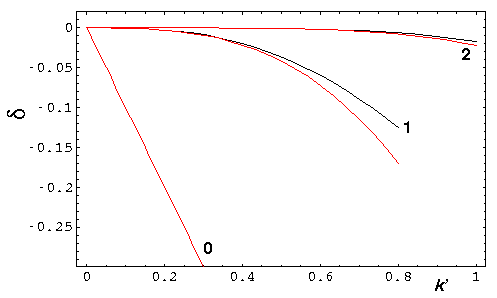
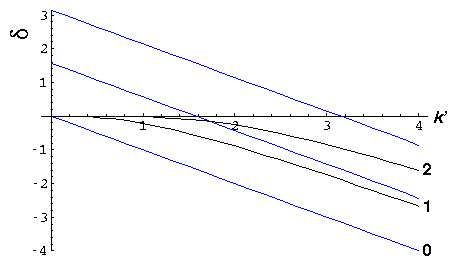
At low energy, all the phase shifts approach zero. l=0 is the slowest
to approach zero, so it is responsible for almost all of the
low-energy scattering. At low energy
 0
0 -ka, and as
a result f
 -a and

 a2, four times
the classical [and high energy] value.
At low energy we have "s-wave" scattering because
b= L/p
so non-zero angular momentum, low energy incident particles "miss by a mile". Only the zero angular momentum particles have a chance to reflect. Alternatively, we could say that the centrifugal potential of non-zero angular momentum incident particles reflects low energy the particles before they can approach the potential. As you would expect for "s-wave" scattering, the scattering is isotropic. Finally one might say that the De Broglie wavelength (h/p) of the beam particles must be smaller than the potential well (a) if it is to "see" the potential well.
At high energy, all the phase shifts for l<k' are "large". We proceed to numerically sum the series for f and find where the scattered particles are going.
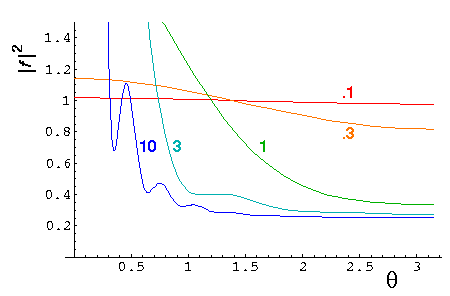
Here are plots of the differential cross-section at k'=.1, .3, 1, 3, and
10. Note we progress from a large uniform cross-section at low energy,
to a cross-section that agrees with the classical result for moderate  ,
but in addition has a strong peak near
  =0. The strong peak is called
the diffraction peak. It exists because the scattered wavefunction must
both produce flux at various scattering angles and subtract flux from the beam,
i.e., form a shadow at
  =0 by interfering with the exp(ikz)
plane wave.
At high energies one can show [e.g., Morse & Feshbach Part II] that the differential cross-section is approximately

where the first term is the classical result and the second term forms the shadow (i.e., the diffraction peak).
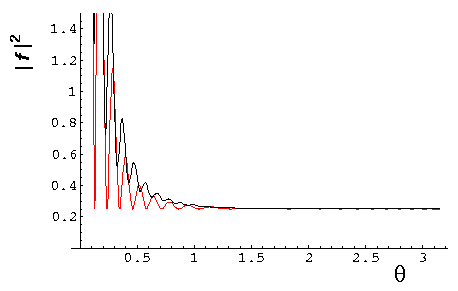
Here is a plot for k'=30 of both the exact result (black) and the above approximation (red).
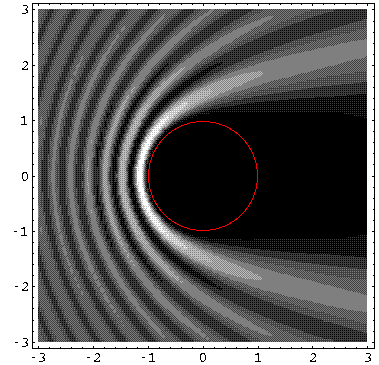
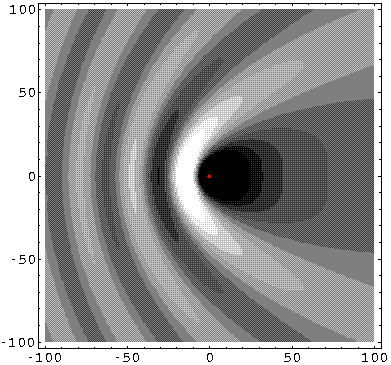
We can display the probability density from our wavefunction.
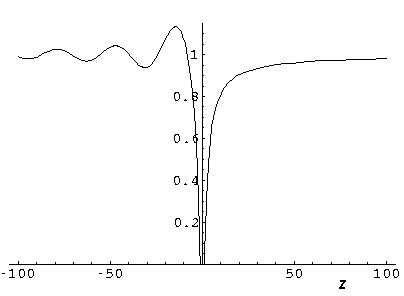
For k'=10, note the clear shadow behind the well.
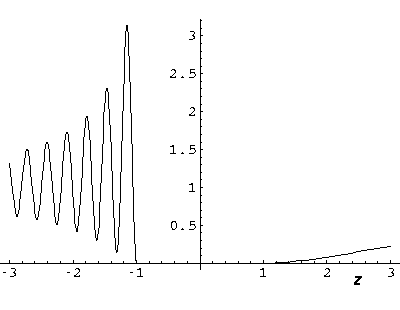
Here is a plot of the probability density along the z-axis:
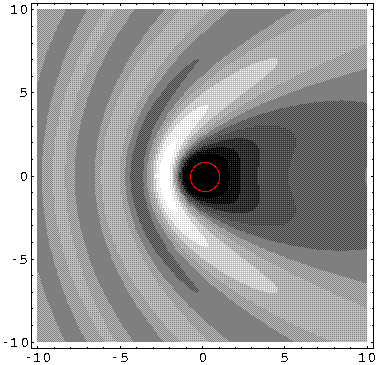
For k'=1 the shadow is much reduced because the longer wavelength waves diffract around the well. (Note the displayed region has been increased, so the 10× longer waves can fit in the picture.)
Here is a plot of the probability density along the z-axis:
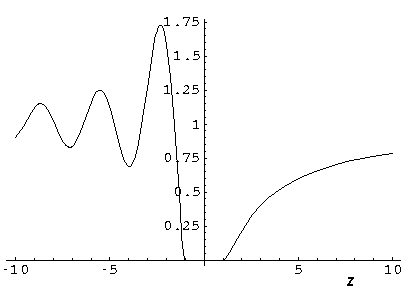
k'=0.1: (Note the displayed region has been increased, so the 10× longer waves can fit in the picture.)
Here is a plot of the probability density along the z-axis:
