 (x)=
NnHn(x/l)exp[½(x/l)2)].
It is, of course, easier to work in terms of the dimensionless
position x'=x/l. As I'm getting tired of putting in all
those ugly primes, I may lapse and write x
when I mean x'.
We now have a set of wavefunctions:  (x)=
NnHn(x/l)exp[½(x/l)2)].
It is, of course, easier to work in terms of the dimensionless
position x'=x/l. As I'm getting tired of putting in all
those ugly primes, I may lapse and write x
when I mean x'.
These wavefunctions should be normalized, i.e., we need to find the factor Nn, such that:
 .
.
Note:  *
* =
|
=
| |2 (* means complex conjugate)
is the probability density and the above
integral is just the requirement that the total probability add up to one,
i.e., the particle must be somewhere.
The result is:

Quantum mechanics says that the particle does not have a
position and that nature limits us to just reporting the probability
of finding the particle in various locations. For each of the above
possible energies there is a corresponding function describing
where the particle is likely to be found: | |2.
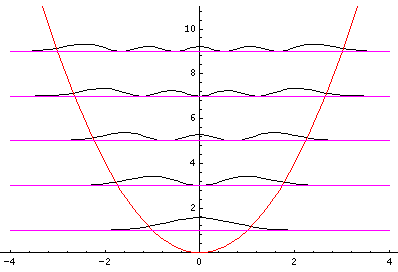
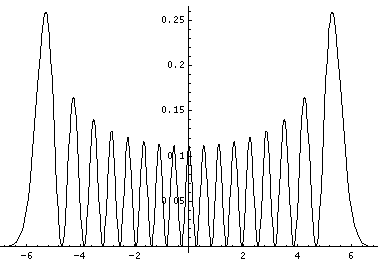
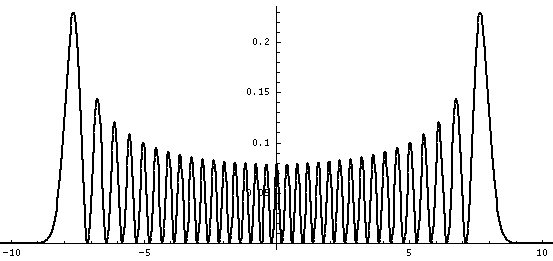
Plotted below are some probability distributions for
n=0,1,2,3,4 (stacked) 16,32 (separately plotted)


These plots say, for example, that you are unlikely to find a particle known to be in the n=2 state at a position x=.8, whereas you are likely to find it at x=1.6. In general peaks where the particle is likely to be found alternate with valleys where the particle is unlikely to be found. This is like fringes in a diffraction experiment: bright illuminated regions alternate with dark unilluminated regions. "Particles" are just like light; quantum mechanics unifies "particles" and "waves" into a single beast, for which we're invented no better name for than "wave-particle".
Note that these probability densities do not depend on time! You should be wondering how it can be that something can oscillate back and forth if there is no time dependence for the particles position probabilities.
Let me take a second to explain this "stacked probability density" display. We are interested in displaying where the particle is likely to be found for several different possible energies. We can display (as I did directly above) individual probability densities on individual plots, but lots of such plots are deemed a waste of space, so we aim to plot several functions on one graph. Imagine what would happen if we try to use the same axes and overplot the above two functions! Thus different functions are moved vertically up to avoid overlapping display. The convention is to move each plot up a distance corresponding to that solution's energy. (Since solutions rarely have the same energy, we're automatically saved from overlapping plots.) Thus the zero line for each probability density function becomes the line of constant energy. This is potentially quite confusing because the y-axis is being used for two two different things with different units and zero points. If we further confuse things by in addition to all of the above plotting the potential energy U(x), we can see the separation of x into classically allowed regions (where the probability oscillates) and classically disallowed regions (in which the probability grows small). The intersection of the constant energy lines with the curve of potential energy, shows the turning points (which bound the classically allowed regions).
Although not physically measurable, the wavefunctions
 are in some sense more fundamental
than the probability densities. While probability densities
must be real and positive, wavefunctions have no such
constraints. (It turns out that for confined particles
the wavefunction can be chosen real [i.e., one can find a time
when they are real], so we can easily plot
those wavefunctions. "Free" wavefunctions are usually
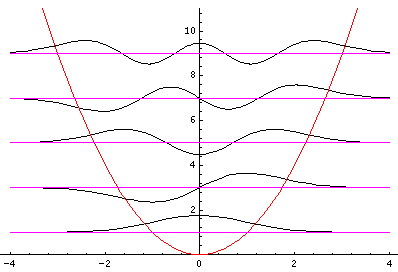
complex.) Here is a stacked plot of the
wavefunctions for n=0,1,2,3,4.

Notice that the n=2 wavefunction is big in magnitude but negative at x=0. Since it's the absolute value squared of the wavefunction that determines probability, x=0 is a likely place to find this particle.
The wavefunctions really do depend on time, but in
a complex way (pun intended): ×exp(-iEt/ )
=×exp(-iE't').
The absolute value of:
exp(i )=
cos
 + i sin
is constant (1), so the probability density doesn't depend on time.