We have found the following wavefunctions for the atom:

with energy E'=½ (1/n2).
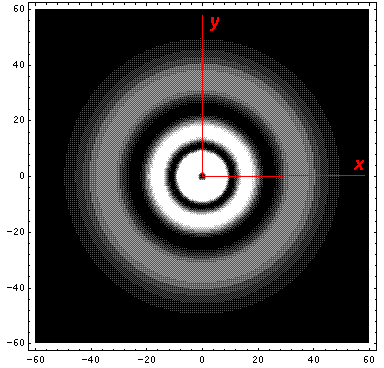
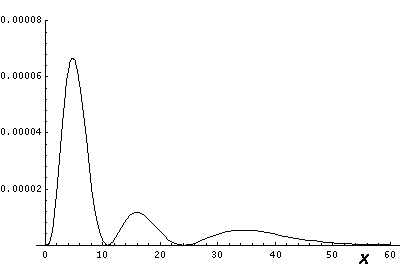
We looked at 1D plots of these wavefunctions, but what do the probability densities look like in space? The l=0 (s-wave) wavefunctions are spherically symmetric, so the 1D plots just show what successive shells around the nucleus look like.
If l isn't zero the
probability densities for these wavefunctions are not spherically
symmetric. However the probability densities (but not the wavefunctions
themselves)
are independent of  ("cylindrically symmetric" for a cylinder
whose axis is aligned with the z axis) so we only need to concern
ourselves with their dependence on
  and r (i.e.,
for example the x-z plane).
(The exp(im
 ) dependence in the wavefunction cancels out in
 *
* .)
The probability density for +m and -m
are identical (since
Yl,-m=(-1)mY*l,m;
the difference is only which way the particle is going
around the z axis. Note that except for l=0 the wavefunction goes to
zero as you approach the origin; the larger the value of l the faster you
go to zero. Note that unless m=0 the wavefunction
is zero on the z axis; again larger |m| means a more
disallowed z axis. For the largest possible |m| (i.e.,
m=±l) the probability is largely near the
x-y plane. Finally, there are always nr radial
nodes (zeros) [not counting the origin].
Note from the 1D plots that the probability density is high near the origin. In fact in the contour plots the central region is "overexposed", i.e., in order to show the details on the large outer lobes, I chose a maximum contour (pure white) that was well below the the first peak's height.
Below we plot the probability density for nr=2, l=1 ("p" wave) for m=0,1. For several of these plots the probability density is also plotted along a particular line.
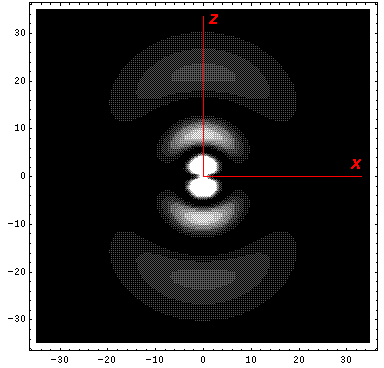
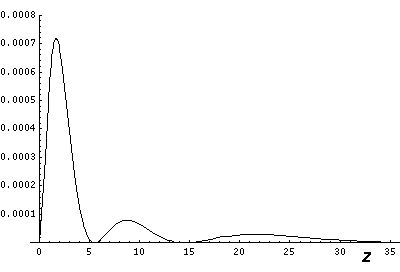
Note that chemists call this the pz orbital. They would use linear combinations of l=1 m=±1 wavefunctions to produce orbitals identical to pz, except located around the x- (called px) and y- (called py) axes. More on this later.
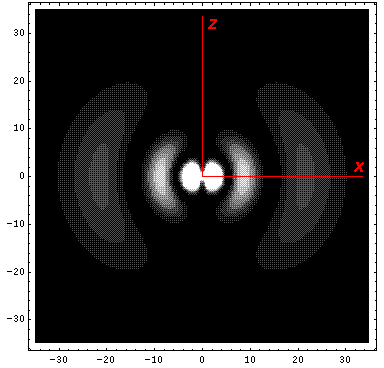
Note that the probability is somewhat confined to the z=0 plane (i.e.,
the x-y plane)
Here is what the probability density looks like in that plane; like all
of these solutions it's  symmetric
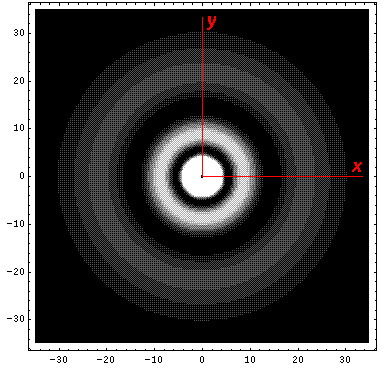
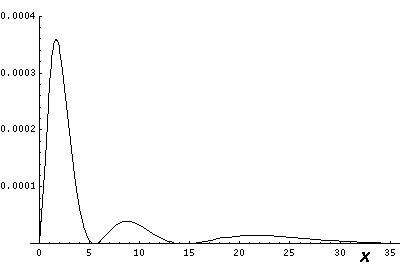
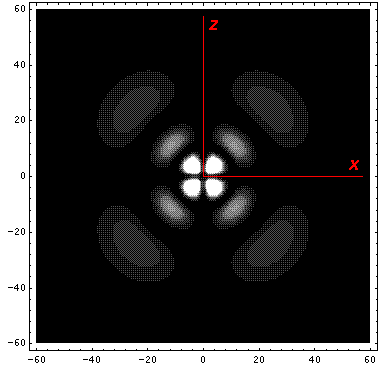
Below we plot the probability density for nr=2, l=2 ("d" wave) for m=0,1,2. For several of these plots the probability density is also plotted along a particular line.
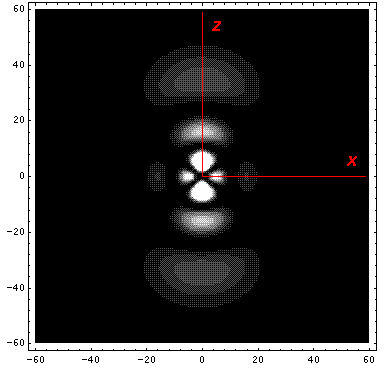
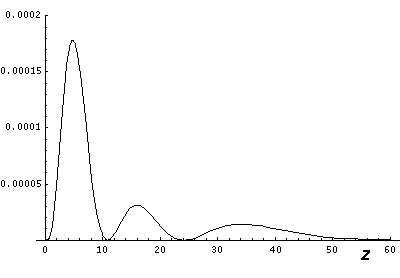
Note that chemists call this the dz2 orbital. Chemists would use linear combinations of l=2 m=±1 wavefunctions to produce orbitals called dxz and dyz. Linear combinations of l=2 m=±2 wavefunctions are used to produce orbitals called dxy and dx2-y2. More on this later.
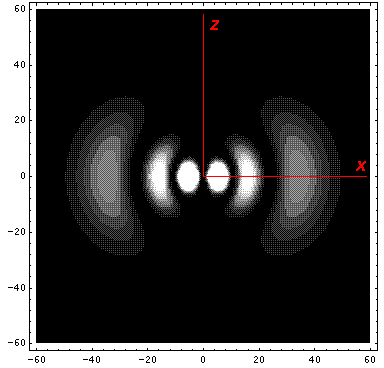
Note that the probability is mostly confined to the z=0 plane (i.e.,
the x-y plane)
Here is what the probability density looks like in that plane; like all
of these solutions it's  symmetric
